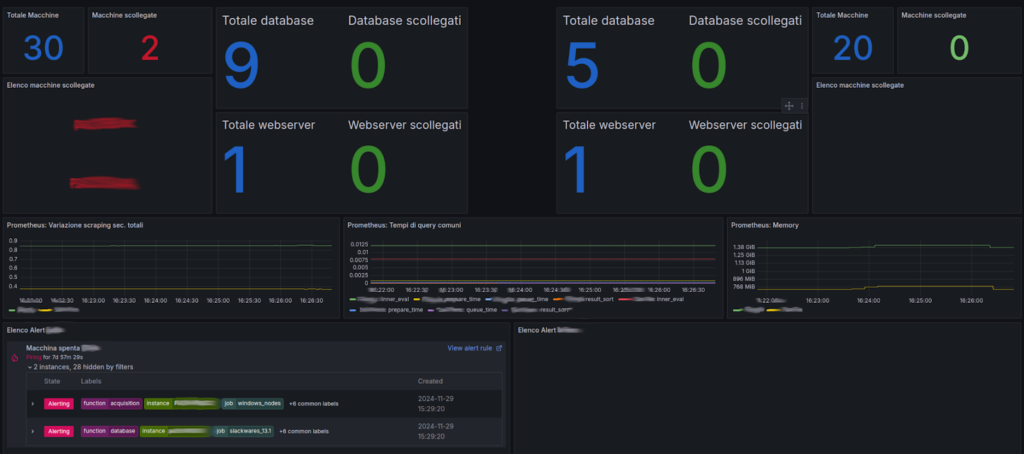
In the last few months we’ve had the opportunity to collaborate with a multinational customer in order to implement an Observability solution for their rather complex IT infrastructure.
Thanks to our previous experience and know-how, we’ve been aware of the requirements we were asked to satisfy since the first meetings.
Among these requirements, the most relevant ones are failure prevention and downtime reduction which were often the cause of productivity loss. The main objective of the project had to be achieved by observing, measuring and notifying, in near real-time, malfunctions or overload that caused slow-downs or interruptions of the company’s industrial pipelines. Other objectives were: a centralized monitoring dashboard for a uniform overview of all, heterogeneous components of the infrastructure; performance optimization through the ex-post analysis of metrics and identification of bottlenecks; the creation of a solid technological base upon which solutions for proactive self-healing can be designed.
The challenge was thus the implementation of an observability solution for the geographically distributed datacenters of our customer. Those datacenters comprise dozens of servers ranging from rather ancient legacy hardware (Slackware 8) to modern virtualized servers based on Ubuntu 22 and Windows 11.
The servers act with diverse roles: databases, web servers, firewalls and industrial machinery controllers equipped with proprietary software.
Approach and Achievements
To meet our customer’s needs, we conducted a comprehensive survey of their infrastructure and decided to base our solution on Prometheus, Grafana and Ansible, tools that we master and that we are able to customize in depth. Here’s how we delivered:
- Deployment and Configuration
- A centralized monitoring server was set up, hosting Prometheus and Grafana.
- We leveraged Ansible to script the provisioning process, enabling centralized and repeatable configurations.
- Metrics Collection
- Standard exporters were deployed to gather metrics from operating systems, databases, and web servers.
- We developed custom exporters in Python for older systems that couldn’t support modern dependencies.
- Tailored Observability for Industrial Processes
- Custom metrics were integrated to monitor and verify the processes controlling industrial machinery, ensuring business-critical systems operated seamlessly.
- Alerting and Notifications
- Alerts were configured for various key metrics.
- Notifications were integrated with Microsoft Teams and email, ensuring prompt action on critical issues.

This tailored observability solution has empowered our customer with real-time insights and full control over their complex infrastructure. For us, this project was a fantastic opportunity to expand our expertise, mastering: Prometheus exporters (including writing dedicated ones); Grafana dashboarding, with intricate queries and visualizations; complex alerting systems tied to real-world processes.
Conclusion
This collaboration stands as a testament to our team’s commitment to solving complex challenges and delivering robust, scalable solutions. We’re proud to have not only met but exceeded expectations, enabling our customer to achieve unprecedented observability for its critical systems.
Got a complex infrastructure challenge? Let’s solve it together!


